Gibbs Sampling
The Gibbs Sampling or the heat bath method was introduced by the Geman brothers in 1984 and it is part of the Markov chain Monte Carlo (MCMC) methods. The purpose of this algorithm is to generate samples from a multivariate probability distribution \(P(\boldsymbol{x})\) that could be complex to sample directly. The algorithm is based on the idea that each conditional probability \(P(x_{i}\vert{x_{j}}_{j \neq i})\) could be sampled.
Algorithm
The Gibbs sampling algorithm is the following:
2. Repeat for \(i= 1,2,\ldots, M\):
- Generate \(x_{2}^{(t+1)}~P(x_{2}|x_{1}^{(t+1)},x_{3}^{(t)}, \ldots, x_{K}^{(t)})\)
- \(\vdots\)
- Generate \(x_{K}^{(t+1)}~P(x_{K}|x_{1}^{(t+1)},x_{2}^{(t+1)}, \ldots, x_{K-1}^{(t+1)})\),
In order to implement the burn-in period (i.e. discarding the first \(n\) samples) we just add \(n\) more samples.
Example
To illustrate the Gibbs Sampling method I will use the traditional bivariate Gaussian distribution example, but if you want to see a harder example you can see the end of this page. Since a bivariate Gaussian \(\mathcal{N}(\boldsymbol{\mu},\boldsymbol{\Sigma})\) is defined by the linear combination of two Normal distribution, \(X\) and \(Y\), then its parameters are based on them, this is:
\[\boldsymbol{\mu}=\begin{pmatrix} \mu_{x}\\ \mu_{y} \end{pmatrix}=\begin{pmatrix} 0\\ 0 \end{pmatrix},\hspace{0.6cm} \boldsymbol{\Sigma}=\begin{pmatrix} \sigma_{x}^2 & \sigma_{x}\sigma_{y}\rho\\ \sigma_{x}\sigma_{y}\rho & \sigma_{y}^2 \end{pmatrix}=\begin{pmatrix} 100 & 8\\ 8 & 1 \end{pmatrix}\]In order to use the Gibbs sampling method, we need to know how to sample \(X\vert Y\) and \(Y\vert X\). It can be shown slides 19 and 20 of this lecture that
\[\mu_{x|y}=\mu_{x}+\sigma_{x}\rho\Big(\frac{y-\mu_{y}}{\sigma{y}}\Big),\hspace{0.6cm}\sigma_{x|y}=\sigma_{x}^{2}(1-\rho^{2})\]and by symmetry:
\[\mu_{y|x}=\mu_{y}+\sigma_{y}\rho\Big(\frac{x-\mu_{x}}{\sigma{x}}\Big),\hspace{0.6cm}\sigma_{y|x}=\sigma_{y}^{2}(1-\rho^{2})\]So now we can use the standard normal distribution to sample each conditional probability as follows:
\[\begin{eqnarray} X|Y & = &\mu_{x|y}+\sigma_{x|y}\mathcal{N}(0,1) \nonumber \\ &=&\mu_{x}+\sigma_{x}\rho\Big(\frac{y-\mu_{y}}{\sigma{y}}\Big)+\sigma_{x}^{2}(1-\rho^{2})\mathcal{N}(0,1) \nonumber \end{eqnarray}\]and
\[\begin{eqnarray} Y|X & =& \mu_{y|x}+\sigma_{y|x}\mathcal{N}(0,1) \nonumber \\ & = & \mu_{y}+\sigma_{y}\rho\Big(\frac{x-\mu_{x}}{\sigma{x}}\Big)+\sigma_{y}^{2}(1-\rho^{2})\mathcal{N}(0,1) \nonumber \end{eqnarray}\]Fig. 1 illustrates the first 100 samples taken from the bivariate Gaussian distribution described in this section.
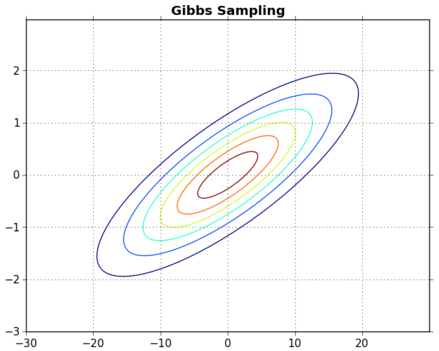 |
| Fig. 1. Sampling a bivariate Guassian distribution using the Gibbs Sampling method. |
Code
I looked for scripts of this particular problem and I found this lab practice in Matlab, which was pretty useful. Please note that there are more lines of code for plotting the samples (lines 26-63) than for sampling the distribution (lines 1-23).
#!/usr/bin/env python

import matplotlib
import numpy as np
import matplotlib.mlab as mlab
import matplotlib.pyplot as plt
import matplotlib.animation as animation

M = 500

meanX = 0.0; sigmaX = 10.0
meanY = 0.0; sigmaY = 1
rho=0.8

x = np.zeros((M+1))
y = np.zeros((M+1))
x[0]=meanX; y[0]=meanY

c=np.sqrt(1-pow(rho,2));
np.random.seed(10)
for i in xrange(1,M+1):
    x[i] = meanX+sigmaX*rho*(y[i-1]-meanY)/sigmaY+ sigmaX*c*np.random.normal(0,1)
    y[i] = meanY+sigmaY*rho*(x[i]-meanX)/sigmaX+ sigmaY*c*np.random.normal(0,1)


# Animation plotting
delta = 0.025
x1 = np.arange(-30.0, 30.0, delta)
x2 = np.arange(-3, 3, delta)
X, Y = np.meshgrid(x1, x2)

covariance=rho*sigmaX*sigmaY
Z = mlab.bivariate_normal(X, Y, sigmaX, sigmaY, meanX, meanY, covariance)

matplotlib.rcParams['xtick.direction'] = 'out'
matplotlib.rcParams['ytick.direction'] = 'out'

fig = plt.figure(1)
plt.contour(X, Y, Z)
plt.title('Gibbs Sampling',fontweight='bold')
plt.grid()
plt.savefig('gibbs001.png')
iterNumLabel = plt.text(10, -2, r'Iteration 1', fontsize=16)

index = 1;
def update(data):
    global index
    if index < M:
        index += 1
    plt.plot(x[index-2:index], [y[index-2], y[index-2]],
                linestyle='--', marker='.',color='#0092EC')
    plt.plot([x[index-1], x[index-1]], y[index-2:index],
               linestyle='--', marker='.',color='#0092EC')
    plt.plot(x[index-2:index],y[index-2:index],linestyle='-', marker='o',color='b')
    plt.savefig('gibbs' +str(index).zfill(3)+'.png')
    iterNumLabel.set_text(r'Iteration '+str(index))
    return None

def data_gen():
    while True: yield None

ani = animation.FuncAnimation(fig, update, data_gen, interval=100)
plt.show()
Additionally, in order to create the gif animation that is shown in Fig. 1 I used ImageMagick with the following bash script.
#!/bin/bash
for f in *.png; do convert -crop 675x540+60+30 +repage -resize 65% "$f" "$f"; done
convert -delay 20 -loop 0 gibbs*.png gibbs.gif
Relationship with Boltzmann Machines
The Gibbs sampling method could be used in the learning and recalling processes of a Boltzmann Machine, specifically in sampling each unit in the simulated annealing step, as suggested by Haykin
References
For the notation and the concepts I mainly used MacKay’s book and for the algorithm statement I used the Research Data Center’s Gibbs Sampling page. I must say that I’m becoming a huge fan of MacKay’s book because the notation is easier to use and understand than other books. Clearly, the algorithm presented here is a combination of both sources.
This post is Open Content under the CC BY-NC-SA 3.0 license. Source code in this tutorial is distributed under the Eclipse Public License.